Visualize Product Life Cycle

Ok, It looks not that charming but really impressive for me.
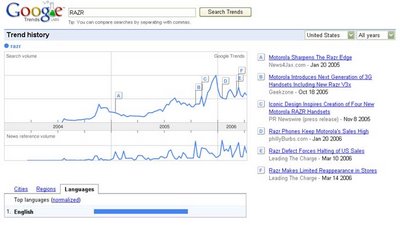
PLC : Product Life Cycle is one of 101 class item and most useful economic theory in marketing for me. I think I can understand by a new method by Google's new LAB project "Google Trend".
Google Trends analyzes a portion of Google web searches to compute how many searches have been done for the terms users enter relative to the total number of searches done on Google over time. The graph is matched with major news issues. You can sort it by cities/regions and languages as well.
For example, if you input "RAZR", you may see the rumor about RAZR was appearing at Q4 of 2004. And then you can see hot buzz when it is finally introduced at market. Around 2005 christmas season, the graph reached at peak point. I think it is interesting the graph has still good strength. I assume it might thanks to RAZR limited edition and other variable versions such as Gold Dolce & Gabana. Now it seems RAZR will be next Startac which has been produced for exceptionally long time. By June 2006, 50 million units of RAZR were sold globally.
SO WHAT?
Google trend will be loved by all marketers and researchers. If this volume shows fame of a keyword, we may regard it as social/cultural interest value by end users. By matching news and event schedule, we may understand how those event affect it. In future, some smart marketers may learn how to keep people's searching keyword for extending product life.
LINKS
Keep eyes on "RAZR" through Google Trends
Learn more about PLC: Product Life Cycle

Comments